
I remember the first time I handed a blank map of Europe to a class of high school sophomores and asked them to sketch the borders from memory. Most couldn’t place Poland relative to Germany. A few labeled France where Spain should be. One student, completely earnest, drew a single large blob and wrote “USSR???” across the top. I wasn’t frustrated with them. I was frustrated with myself for assuming they’d absorbed geographic context just because I’d mentioned country names while lecturing about the war. That moment forced me to rethink how I approached the World War 2 map of Europe from the very first day of the unit.
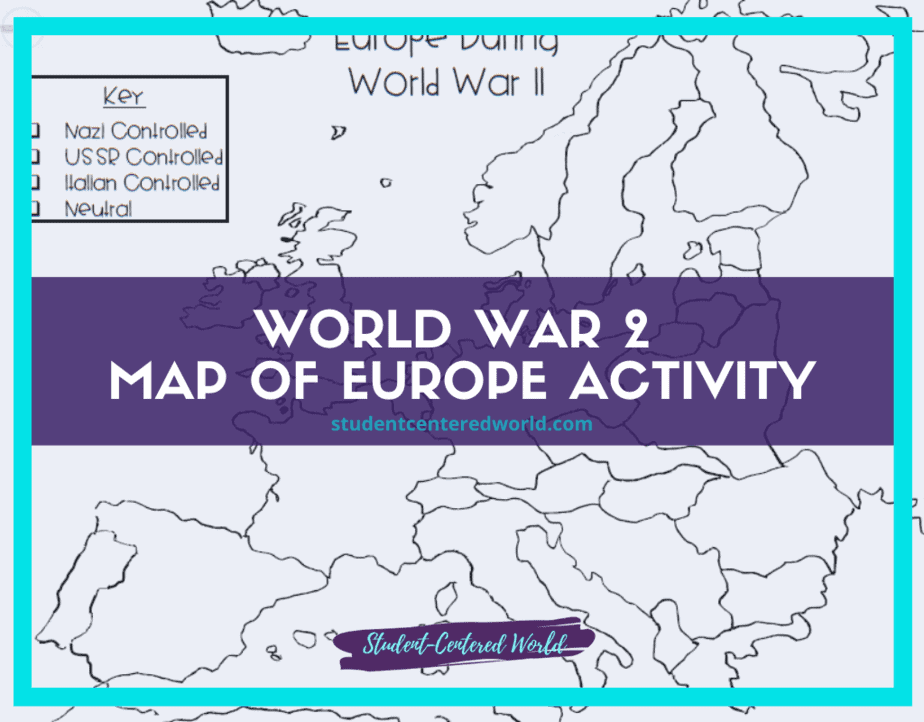
In the second semester of my second year of teaching, I made a deliberate shift. Instead of treating the WWII map of Europe as a reference slide I clicked past, I built an entire lesson around it. I gave my period-four class physical copies of a map of Europe during World War 2 and asked them to color-code occupied territories, neutral nations, and Allied powers. The difference in their comprehension of that unit was immediate. When I referenced the Eastern Front, they knew where it was. When we discussed the Nazi-Soviet Pact, they understood the strategic implications of Poland’s location.
For the first time, geography wasn’t an afterthought. It was the foundation on which everything else sat.
That experiment with my period-four class sparked a permanent change in how I taught the war. Over the next few years, I refined the activity, creating multiple versions of both a WWII Europe map activity and a post-WWII Europe map activity. I needed versions that would work for my inclusion students, my advanced placement students, and everyone in between. The map of Europe after World War 2 became its own separate lesson later in the unit because students needed time to process the territorial shifts that created the Cold War landscape.
Having taught over 1,700 students across both a nationally ranked academic school and a Title I CTE school, I learned that geography comprehension doesn’t develop through osmosis. My teaching career began in 2007, and the gap between what students were expected to know about European geography and what they actually knew was enormous from the start. Since 2018, I’ve been training K-12 teachers on student-centered learning strategies rather than standing in front of a classroom myself.
The map activity I developed for World War II remains one of the most requested resources I share with the teachers I coach. I’ve written extensively about these approaches in The Classroom Dichotomy and have been fortunate to share them with outlets such as Business Insider and Teach Better. The core insight is the same one I learned in that second-year classroom: if students don’t know where events happened, they struggle to understand why they happened.
The version I developed and refined throughout my teaching career spans two distinct maps. The first map captures Europe during the height of Axis expansion. Students identify which nations fell under Nazi occupation, which remained neutral, and which aligned with the Allies. The second map shows the post-WWII Europe map with redrawn borders, the division of Germany, and the emerging Soviet sphere of influence. When students placed these maps side by side in my classroom, the territorial changes stopped being abstract details. They became the story.
I watched students have genuine “aha” moments while completing this World War 2 map activity for students. One year, a young woman in my third-period class stared at her completed map of Europe, 1939 vs. 1945, and said, “Poland basically moved west.” She was right, and that observation led to a class discussion about forced migration, Soviet territorial ambitions, and the human cost of redrawn borders. That conversation couldn’t have happened if she’d only read about it in a textbook paragraph.
Why Geography Deserves More Than a Passing Glance
Teachers often rush through the geography component of a WWII lesson plan because it feels like a supplement. The pressure to cover causes, major battles, the Holocaust, and the war’s conclusion leaves little room for what seems like a background skill. My experience suggests the opposite is true. When students build a mental map early, every subsequent lesson lands more effectively.
The World War 2 Europe borders shifted so dramatically between 1939 and 1945 that simply telling students about the changes doesn’t work. They need to see them. They need to trace the movement of the Eastern Front. They need to color the expansion of Axis-controlled Europe and then watch that territory shrink as Allied forces advanced. The physical act of labeling and color-coding commits the information to memory in a way that reading or listening never will.
What the During-War Map Reveals
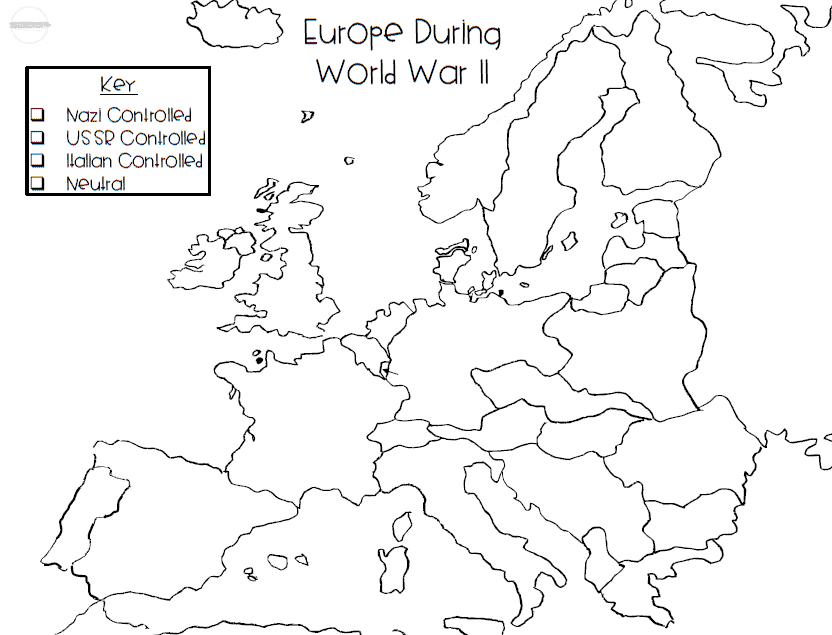
The first map in the activity captures Europe at the height of Axis territorial control. Students work with a Nazi-controlled Europe map classroom activity that asks them to identify which nations fell under German occupation, which aligned with the Axis, which remained neutral, and which formed the core of the Allied resistance. Some versions of the handout provide pre-labeled countries. Others leave the map completely blank, requiring students to locate and label each nation independently.
This differentiation developed organically from my experience teaching mixed-ability classes. In my Title I CTE school, many students arrived with weak geography skills and significant gaps in background knowledge. Handing them an unlabeled map created frustration, not learning. I created a version with country names printed directly on the map so those students could focus on the color-coding key and the comprehension questions rather than struggling to identify countries from memory. My advanced classes received the blank version and the additional challenge of researching occupation dates for each conquered nation.
The instruction sheets offer similar flexibility. One version lists countries grouped by occupation status, providing clear scaffolding. Another lists countries alphabetically, requiring students to determine each nation’s wartime status independently. The most advanced version asks students to record not just the occupation status but also the specific dates on which each country fell under Axis control. That third version generated some of the most productive struggles I saw in my classroom. Students consulted primary source documents, debated conflicting information, and developed genuine research skills alongside their geographic knowledge.
What the Post-War Map Illuminates
The second map shifts to the post-WWII Europe map, where the activity connects directly to the Cold War unit. Students see Germany divided into occupation zones. They examine the inset map of Berlin, a city split into four sectors despite sitting deep inside the Soviet zone. The WWII territorial changes in the Europe map reveal that Poland’s borders shifted westward, the Soviet Union absorbed the Baltic states, and an Iron Curtain descended across the continent.
Comparing the map of Europe before and after World War 2 reveals something textbooks describe, but students rarely internalize. The war didn’t just end. It reshaped the political geography of an entire continent. When students color the Soviet sphere of influence stretching from East Germany to Romania, they begin to understand why Cold War tensions emerged so quickly after 1945. The map makes the geopolitical reality tangible.
The post-war map also includes a labeled and unlabeled version with the same color-coding structure. Students who struggled with the during-war map often found the post-war version more accessible because the borders are less chaotic. The occupation zones in Germany and the clear east-west division provide a visual clarity that helps students organize the information.
How This Works in Actual Classrooms
This activity has been adapted for middle school, high school, and homeschool settings. I used it in Google Classroom as a digital assignment where students completed the color-coding in Google Slides and submitted their comprehension questions through a linked Google Form. I also printed the maps on 11×17 paper and let students work in pairs with colored pencils, which created a different kind of engagement entirely. Both formats work. The choice depends on your students and your available resources.
For a middle school World War 2 activity, I recommend starting with the pre-labeled during-war map and the simpler instruction sheet. Middle school students often benefit from the scaffolding of seeing country names on a map as they focus on understanding alliance structures. The color-coding element appeals to this age group in a way that traditional worksheets don’t, and the activity moves quickly enough to hold their attention.
For a high school World War 2 activity, the blank maps and the research-intensive instruction sheets push students toward higher-order thinking. I had students use this as the foundation for a larger inquiry project where they investigated why specific border changes occurred and how those changes affected civilian populations. One group traced the history of the Sudetenland from 1938 through 1945 and presented their findings alongside their completed maps. The geographic foundation made their research presentation substantially stronger.
Homeschool World War 2 instruction benefits from this activity’s flexibility. A parent teaching one child can sit alongside the student and work through the maps together, using the comprehension questions as discussion prompts. The differentiated levels allow the activity to grow with the student. A younger learner might use the pre-labeled maps while an older sibling works with the blank versions and the research extension.
Why our students need to look at maps
Again, it is important that we are still teaching our students about maps in the classroom. We live in an era of GPS, and it is vital that our children still read maps.
As a matter of fact, the Washington Post published an eye-opening article on the use of GPS devices and the decline in hippocampal development. To quote:
“In a study published in Nature Communications in 2017, researchers asked subjects to navigate a virtual simulation of London’s Soho neighborhood and monitored their brain activity, specifically the hippocampus, which is integral to spatial navigation. Those who were guided by directions showed less activity in this part of the brain than participants who navigated without the device. “The hippocampus makes an internal map of the environment, and this map becomes active only when you are engaged in navigating and not using GPS,” Amir-Homayoun Javadi, one of the study’s authors, told me.
The hippocampus is crucial to many aspects of daily life. It allows us to orient in space and know where we are by creating cognitive maps. It also allows us to recall events from the past, which is known as episodic memory. And, remarkably, it is the part of the brain that neuroscientists believe gives us the ability to imagine ourselves in the future.“
O’Connor, M.R. “Ditch the GPS. It’s Ruining Your Brain.” The Washington Post, 5 June 2019, www.washingtonpost.com/opinions/ditch-the-gps-its-ruining-your-brain/2019/06/05/29a3170e-87af-11e9-98c1-e945ae5db8fb_story.html.
My Honest Take on Implementing This
After years of refining this activity and observing students’ responses, I developed some strong opinions about its implementation. Don’t try to complete both maps in a single class period. The during-war map deserves its own session with time for discussion afterward. The post-war map works best as part of the lesson where you introduce the war’s end and the emergence of Cold War tensions. Separating them allows students to process the geographic changes in stages and creates a natural bridge between your WWII and Cold War units.
I’d also recommend keeping physical copies on hand, even if you primarily use Google Classroom. There’s something about the tactile experience of coloring a map that digital tools can’t replicate. When students completed the digital version, they finished faster but retained less, as shown by the comprehension question results I tracked. When they worked with colored pencils and paper maps, the conversations around tables were richer. Students pointed at each other’s maps, debated border placements, and physically traced invasion routes with their fingers. That kind of interaction matters.
The comprehension questions that accompany the maps deserve their own attention. The questions ask students to compare the during-war and post-war maps directly. These comparisons build the analytical skills that standardized tests and document-based questions demand. More importantly, they help students understand that borders are human constructions with enormous consequences for the people who live within them.
This is a differentiated World War 2 map activity that adapts to your students’ needs. It includes both the during-war and post-war maps in multiple formats, all instruction sheet variations, answer keys, and the comprehension question set.
You can find the complete resource here.

How do I teach the World War 2 map of Europe to students with weak geography skills?
Start with the pre-labeled map version that includes country names printed directly on the map. Focus on the color-coding key rather than country identification. Students with weak backgrounds in geography succeed when the activity emphasizes understanding alliance structures and territorial changes rather than memorizing locations from scratch. Build the geography skills gradually across multiple units rather than expecting mastery in a single lesson.
What’s the difference between the during-war map and the post-war map?
The during-war map shows Europe at the height of Axis expansion, with countries categorized as Axis-controlled, Allied, neutral, or under Soviet influence. The post-war map shows Europe after 1945 with redrawn borders, the division of Germany into occupation zones, and the emerging Soviet sphere of influence in Eastern Europe. Using both maps helps students visualize the territorial changes that occurred as a direct result of the war.
Can this activity work for middle school students?
It works well for middle school students when you use the pre-labeled maps and the simpler instruction sheet that groups countries by occupation status. The color-coding element keeps younger students engaged, and the activity length fits a typical middle school class period. It has also been used successfully with upper elementary students in homeschool co-op settings by having them complete the map as a guided whole-group activity.
How do I adapt this for Google Classroom?
Upload the map images and instruction sheets as Google Slides backgrounds or insert them into Google Docs. Students can use the shape and text box tools to label territories and the fill tool to color-code regions. Create a linked Google Form for the comprehension questions to streamline assessment. The digital format works, though keeping physical copies as an option for students who benefit from hands-on work is worth the extra preparation time.
Why do students need to learn about borders that changed 80 years ago?
The borders established after World War 2 still shape international relations today. Conflicts in the Balkans, tensions between Russia and former Soviet states, and the ongoing significance of NATO all trace back to the territorial decisions made between 1945 and 1949. When students understand how the post-WWII Europe map was drawn, they have a framework for understanding contemporary geopolitical issues that appear in the news.
What if my students refuse to engage with a map activity?
Students sometimes push back against anything they perceive as “coloring.” What worked in my classroom was framing the activity as detective work rather than an art class. Connecting the geography directly to the stories of the people affected, rather than treating it as a standalone skill, shifted the dynamic. Some students took weeks to fully engage, but the gains in comprehension made the persistence worthwhile.
This article was originally published on February 7, 2020